With BusinessObjects Web Intelligence it is relatively straight forward to create a pie chart. Often the data you are working with will create a pie chart that displays hundreds of unique slices, many of which are so small that you can’t see them. How do you go about combining these smaller pie slices into an “Other” category?
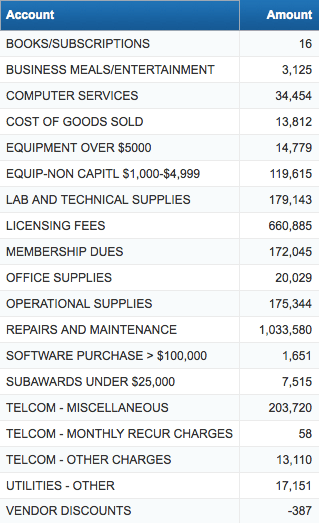
Consider a BusinessObjects Web Intelligence Document with the following data in a Block
 Turning this data into a pie chart will display 19 unique slices. With this data we would like to combine some of the smaller accounts into a group called “Other”. Specifically we would like no individual slice of the pie to represent less than 5% of the total.
Create a variable (vPercentage) that calculates the percentage
This is a very simple variable (vPercentage) with a formula of: [sourcecode gutter=“false”]=Percentage([Amount])[/sourcecode]
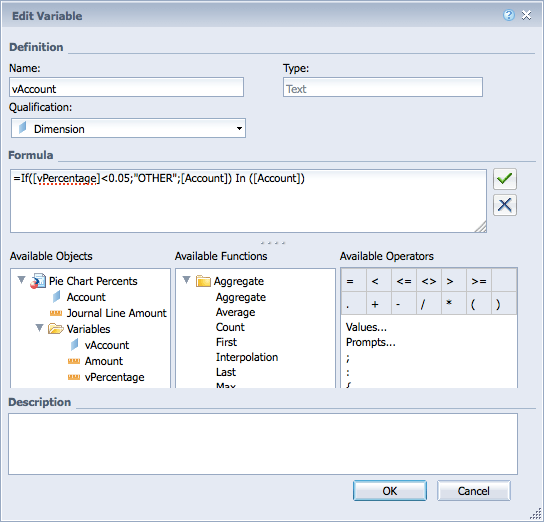
Create a variable (vAccount) that displays the account consolidation
This variable is more complex using the formula below: [sourcecode gutter=“false”]=If([vPercentage]<0.05;“OTHER”;[Account]) In ([Account])[/sourcecode]  The logic for this variable is that if the Percentage is less than 5%, then combine the amounts into “OTHER”, otherwise just display the native value from the Account dimension. The key to this variable working is the last part “In ([Account])”. If this is not included you may receive a #CONTEXT error. “In” is a context operator that specifies dimensions explicitly in a context. This is needed when you do not have a dimension in a data block that is needed for the context of a calculation. And no, you can’t just hide the dimension you need in your block. That will not achieve the desired results. As an added benefit, this method will combine any negative amounts in the data that are so troublesome for a pie chart. Hopefully these negative amounts are more than offset by positive amounts resulting in a net positive amount as shown below where the negative vendor discounts amount from above is hidden inside the other account.
Here is what the sample data looks like Consolidated with this new variable
 This data is now easier to comprehend and turning it into a pie chart is a simple process.
Create a Pie Chart
Here is the resulting pie chart from the data above. I didn’t spend much time making the chart pretty, but you get the idea.  Variables and Contexts are complex topics to understand, but I hope this post helps you to appreciate what is possible with BusinessObjects Web Intelligence.